推論統計
中央極限定理
import numpy as np
from scipy.stats import *
import matplotlib.pyplot as plt
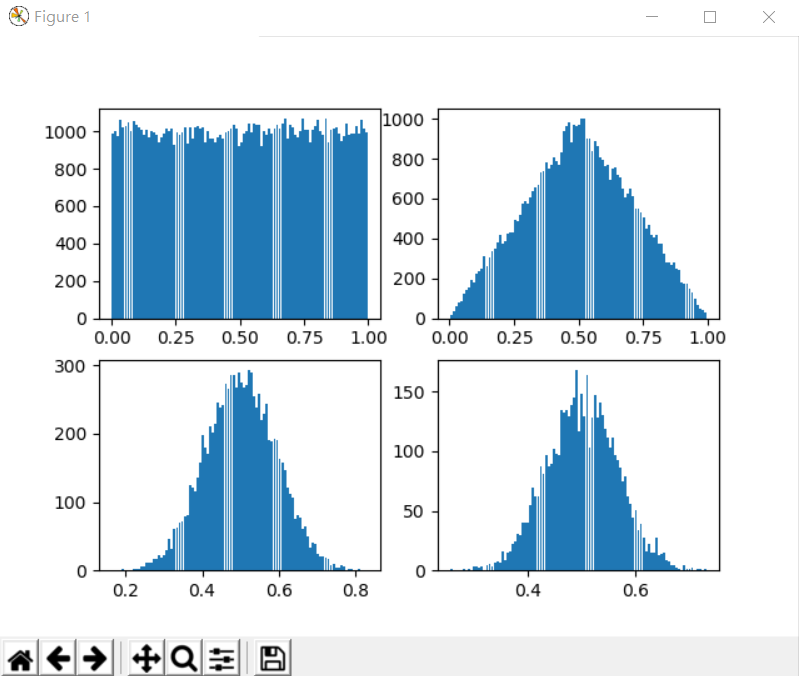
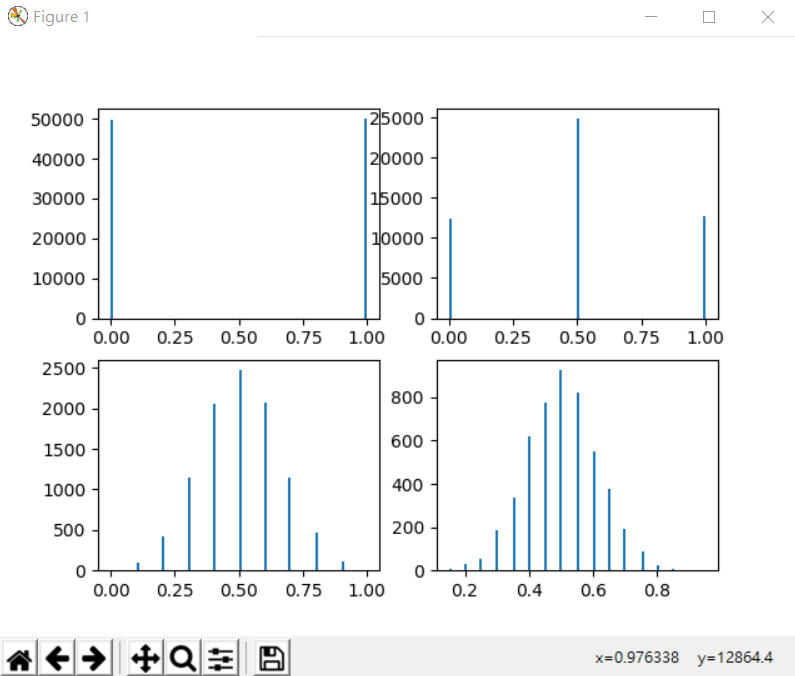
def CLT(s, bins=100, rwidth=0.9):
n = len(s)
fig, axs = plt.subplots(2, 2) # 設為 2*2 的四格繪圖版
# 1 個一組平均
s1 = np.array(s)
axs[0,0].hist(s1, bins=bins, rwidth=rwidth)
# 2 個一組平均
s2 = s1.reshape((2, int(n/2))).sum(axis=0)/2
axs[0,1].hist(s2, bins=bins, rwidth=rwidth)
# 10 個一組平均
s10 = s1.reshape((10, int(n/10))).sum(axis=0)/10
axs[1,0].hist(s10, bins=bins, rwidth=rwidth)
# 20 個一組平均
s20 = s1.reshape((20, int(n/20))).sum(axis=0)/20
axs[1,1].hist(s20, bins=bins, rwidth=rwidth)
plt.show() # 顯示圖形
n = 100000
CLT(uniform.rvs(size=n))
CLT(np.random.choice([0,1], size=n))
CLT(np.random.choice([1,2,3,4,5,6], size=n))
執行結果
$ python clt1.py
檢定
雙樣本檢定
# https://stackoverflow.com/questions/22611446/perform-2-sample-t-test
import numpy as np
from scipy.stats import ttest_ind, ttest_ind_from_stats
from scipy.special import stdtr

np.random.seed(1)

# Create sample data.
a = np.random.randn(40)
b = 4*np.random.randn(50)

# Use scipy.stats.ttest_ind.
t, p = ttest_ind(a, b, equal_var=False)
print("ttest_ind:            t = %g  p = %g" % (t, p))

# Compute the descriptive statistics of a and b.
abar = a.mean()
avar = a.var(ddof=1)
na = a.size
adof = na - 1

bbar = b.mean()
bvar = b.var(ddof=1)
nb = b.size
bdof = nb - 1

# Use scipy.stats.ttest_ind_from_stats.
t2, p2 = ttest_ind_from_stats(abar, np.sqrt(avar), na,
                              bbar, np.sqrt(bvar), nb,
                              equal_var=False)
print("ttest_ind_from_stats: t = %g  p = %g" % (t2, p2))

# Use the formulas directly.
tf = (abar - bbar) / np.sqrt(avar/na + bvar/nb)
dof = (avar/na + bvar/nb)**2 / (avar**2/(na**2*adof) + bvar**2/(nb**2*bdof))
pf = 2*stdtr(dof, -np.abs(tf))

print("formula:              t = %g  p = %g" % (tf, pf))
執行
$ python ttest1.py
ttest_ind:            t = -1.5827  p = 0.118873
ttest_ind_from_stats: t = -1.5827  p = 0.118873
formula:              t = -1.5827  p = 0.118873