機率分布 (連續型)
簡介
| 連續機率模型 | 密度函數 | R 函數 | 說明 |
|---|---|---|---|
| 常態分布(Normal) | $\frac{1}{\sqrt{2\pi} \sigma} e^{- \frac{1}{2} [(x-\mu)/\sigma]^2}$ | norm(mean, sd) | 中央極限定理:x1+x2+…+xk; 當 k 越大就越接近常態分布 |
| 伽瑪分布 (Gamma) | $\frac{1}{\Gamma(a) b^{a}} x^{a-1} e^{-x/b}$ | gamma(shape, rate = 1, scale = 1/rate) | $\Gamma(k) = \int_{0}^{\infty} z^{k-1} e^{-z} dz$ 指數分布與卡方分布都是 Gamma 分布的特例 |
| 指數分布 (Exponential) | $\frac{1}{b} e^{-x/b}$ | exp(rate) | 伽瑪分布($a=1, b=\frac{1}{\lambda}$) 布瓦松過程中,第一次事件出現的時間 W |
| 卡方分布 (Chi-Square) | $\frac{1}{2^{\gamma/2}\Gamma(\gamma/2)},x^{\gamma/2 - 1} e^{-x/2}$ | chisq(df, ncp) | 伽瑪分布( $b=2, a=\gamma/2$ ) 利用樣本推斷母體變異數 |
| 均勻分布 (Uniform) | $\frac{1}{b-a}$ | unif(a:min, b:max) | a:範圍下限, b: 上限 出現機會均等 |
| 柯西分布 (Cauchy) | $\frac{1}{\pi} \frac{a}{a^2 + (x-b)^2}$ | cauchy(b:location, a:scale) | |
| 威布爾分布 (Weibull) | $a b x^{b-1} e^{-a x^{b}}$ | weibull(a:shape, b:scale) | $\rho(t)=\frac{f(t)}{R(t)}$ 可靠度工程:f(x) 失敗時間, R(t) 可靠度,$\rho(t)$ 失敗率 |
| T 分布 (T) | $\frac{Z}{\sqrt{X_{\gamma}^2/\gamma}}$ | t(df, ncp) | 估計變異數時使用的分布 |
| F 分布 (F) | $\frac{X_{\gamma_1}^2 / \gamma_1}{X_{\gamma_2}^2/\gamma_2}$ | f(df1, df2, ncp) | 等變異數 F 檢定時使用 |
| 貝塔分布 (Beta) | $f(x)= \frac{Γ(a+b)}{Γ(a) Γ(b)} x^{a-1}(1-x)^{b-1}$ | beta(a:shape1, b:shape2, ncp) | |
| 對數常態分布 (Log Normal) | lnorm(meanlog, sdlog) | ||
| 邏輯分布 | logis(location, scale) | ||
| Signrank | signrank(n) | ||
| 威爾斯 | wilcox(m, n) | a,b 為兩組樣本 |
均勻分布 (Uniform distribution)
意義:在範圍 (a,b) 內的出現機會均等。
R 函數:unif(a:min, b:max)
課本公式:$f(x) = \frac{1}{b-a}$
R 的公式:f(x) = 1/(max-min)
變數意義:a:min 範圍下限, b:max 上限
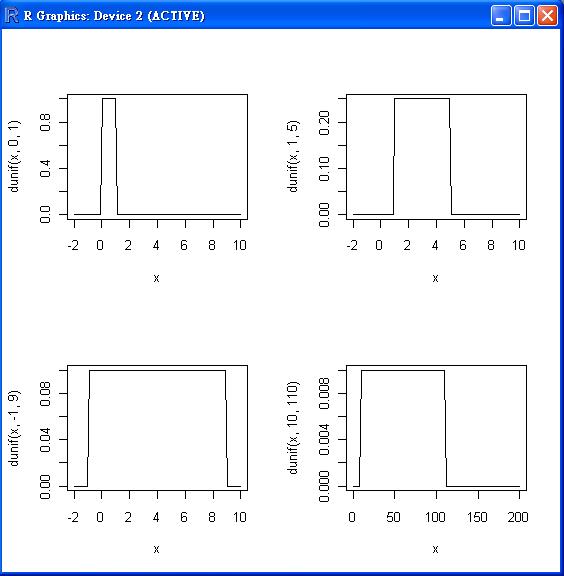
R 程式範例
> op=par(mfrow=c(2,2))
> curve(dunif(x, 0, 1), -2, 10)
> curve(dunif(x, 1, 5), -2, 10)
> curve(dunif(x, -1, 9), -2, 10)
> curve(dunif(x, 10, 110), 0, 200)
>
常態分布 (Normal Distribution)
意義:有誤差的對稱性分布形式,中央高兩邊低的形式。
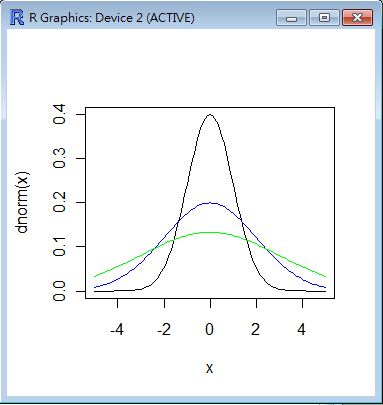
繪圖:用 R 繪製標準差為 1, 2, 3, 的常態分布。
curve(dnorm(x), -5, 5, col="black")
curve(dnorm(x, sd=2), -5, 5, col="blue", add=T)
curve(dnorm(x, sd=3), -5, 5, col="green", add=T)
R 函數:norm(mean, sd)
公式:$\frac{1}{\sqrt{2\pi} \sigma} e^{- \frac{1}{2} [(x-\mu)/\sigma]^2}$
R 的公式:f(x) = 1/(√(2 π) σ) e^-((x - μ)^2/(2 σ^2))
重要性:根據中央極限定理,任何 n 個獨立樣本的平均值趨近於常態分布。
中央極限定理: $x_1+x_2+…+x_n \rightarrow N(\mu, \delta/\sqrt{n})$
標準差
1 標準差: $P[-1 \sigma < X-\mu < 1 \sigma] \simeq 0.68$ .
2 標準差: $P[-2 \sigma < X-\mu < 2 \sigma] \simeq 0.95$ .
3 標準差: $P[-3 \sigma < X-\mu < 3 \sigma] \simeq 0.997$ .
> pnorm(1)-pnorm(-1)
[1] 0.6826895
> pnorm(2)-pnorm(-2)
[1] 0.9544997
> pnorm(3)-pnorm(-3)
[1] 0.9973002
> pnorm(4)-pnorm(-4)
[1] 0.9999367
> pnorm(5)-pnorm(-5)
[1] 0.9999994
> pnorm(6)-pnorm(-6)
[1] 1
所以現在大家應該知道「工業管理學」上「六標準差」的要求,是很嚴苛的了吧!
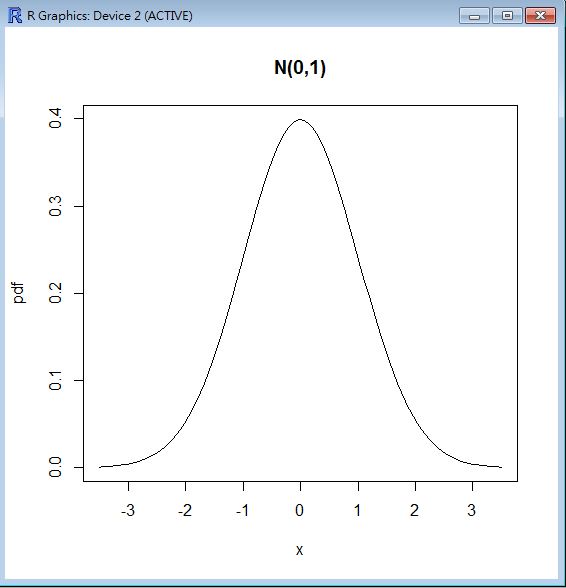
R 程式範例
> dnorm(0)
[1] 0.3989423
> dnorm(0.5)
[1] 0.3520653
> dnorm(2.5)
[1] 0.0175283
> curve(dnorm(x), from = -3.5, to = 3.5, ylab="pdf", main="N(0,1)")
>
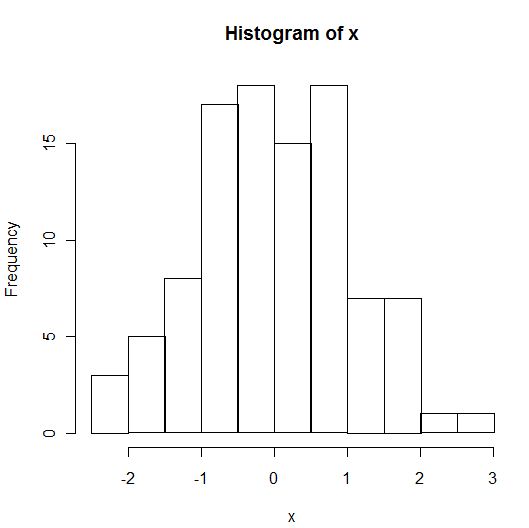
> x = rnorm(100)
> hist(x, nclass=8)
>
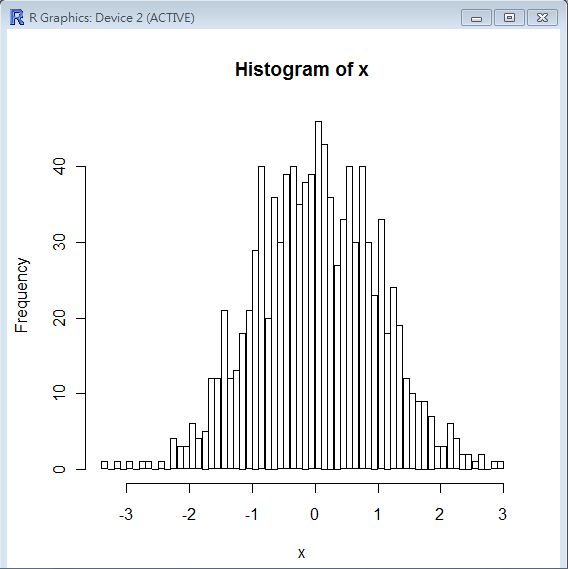
> x = rnorm(1000)
> hist(x, nclass=50)
>
伽瑪分布 (Gamma distribution)
$f(x) = \frac{1}{\Gamma(\alpha) \beta^{\alpha}} x^{\alpha-1} e^{-x/\beta}$
R 的寫法: $gamma(shape=a, rate=s) = \frac{1}{\Gamma(a) s^a } x^{a-1} e^{-x/s}$
R函數:Gamma(shape, rate)
- 公式: f(x)= 1/(s^a Gamma(a)) x^(a-1) e^-(x/s)
- 對應:[$ shape = a = \alpha; scale = s = \beta $]]
- 意義:指數分布與卡方分布都是 Gamma 分布的特例
- 網址:http://stat.ethz.ch/R-manual/R-patched/library/stats/html/GammaDist.html
Gamma 函數的定義: $\Gamma(k) = \int_{0}^{\infty} z^{k-1} e^{-z} dz$
特性:
- $E(X) = \alpha \beta$
- $Var(X) = \alpha \beta^2$
動差生成函數: $m_x(t) = (1-\beta t)^{-\alpha}$
R 程式範例一
op=par(mfrow=c(2,2))
curve(dgamma(x, 1,1), 0, 10)
curve(dgamma(x, 1,5), 0, 10)
curve(dgamma(x, 5,1), 0, 10)
curve(dgamma(x, 5,5), 0, 10)
[=image dgammaCurve4.jpg size=“medium”]]
R 程式範例二
-log(dgamma(1:4, shape=1))
p <- (1:9)/10
pgamma(qgamma(p,shape=2), shape=2)
1 - 1/exp(qgamma(p, shape=1))

# even for shape = 0.001 about half the mass is on numbers
# that cannot be represented accurately (and most of those as zero)
pgamma(.Machine$double.xmin, 0.001)
pgamma(5e-324, 0.001)  # on most machines 5e-324 is the smallest
                       # representable non-zero number
table(rgamma(1e4, 0.001) == 0)/1e4
執行結果:
> -log(dgamma(1:4, shape=1))
[1] 1 2 3 4
> p <- (1:9)/10
> pgamma(qgamma(p,shape=2), shape=2)
[1] 0.1 0.2 0.3 0.4 0.5 0.6 0.7 0.8 0.9
> 1 - 1/exp(qgamma(p, shape=1))
[1] 0.1 0.2 0.3 0.4 0.5 0.6 0.7 0.8 0.9
>
> # even for shape = 0.001 about half the mass is on numbers
> # that cannot be represented accurately (and most of those as zero)
> pgamma(.Machine$double.xmin, 0.001)
[1] 0.4927171
> pgamma(5e-324, 0.001)  # on most machines 5e-324 is the smallest
[1] 0.4752741
>                        # representable non-zero number
> table(rgamma(1e4, 0.001) == 0)/1e4

 FALSE   TRUE
0.5188 0.4812
>
參考文獻
指數分布 (Exponential Distribution)
$P(X=x) = \frac{1}{\beta} e^{-x/\beta} = \lambda {e}^{- \lambda x}$
- 範圍:x=0,…,k (取出 x 個白球)
- 意義:白球有 m 個,黑球 n 個,取出 k 個球,其中有 x 個白球的機率; (取後不放回)
- R 函數: [$ exp(rate) ; rate = 1/\beta = \lambda $]]
- http://stat.ethz.ch/R-manual/R-patched/library/stats/html/Hypergeometric.html
特性
- $E(X) = k (\frac{m}{m+n})$
- $Var(X) = k (\frac{n}{m+n}) (\frac{m}{m+n}) (\frac{m+n-k}{m+n-1})$
動差生成函數:$m_x(t) = (1-\beta t)^-1$
R 程式範例一
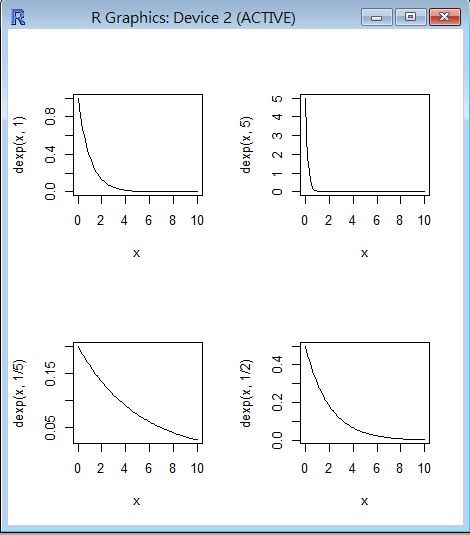
op=par(mfrow=c(2,2))
curve(dexp(x, 1), 0, 10)
curve(dexp(x, 5), 0, 10)
curve(dexp(x, 1/5), 0, 10)
curve(dexp(x, 1/2), 0, 10)
R 程式範例二
> dexp(1) - exp(-1) #-> 0
[1] 0
參考文獻
卡方分布 (Chi-Square distribution)
公式: $\frac{1}{2^{\gamma/2}\Gamma(\gamma/2)},x^{\gamma/2 - 1} e^{-x/2}$
R 的公式: $chisq(df=n > 0) = f_n(x) = \frac{1}{(2^{n/2} \Gamma(n/2)} x^{n/2-1} e^{-x/2}$
R函數:chisq(df=n, ncp=λ)
- 公式: f(x) = exp(-λ/2) SUM_{r=0}^∞ ((λ/2)^r / r!) dchisq(x, df + 2r)
- 網址:http://stat.ethz.ch/R-manual/R-patched/library/stats/html/Chisquare.html
特性
卡方分配主要用途是在「利用樣本推斷母體變異數」時使用的。
卡方分配是伽瑪分布的特例,只要將 Gamma 分配中設定 $b=2, a=\gamma/2$ 就是卡方分布了。
R 程式範例
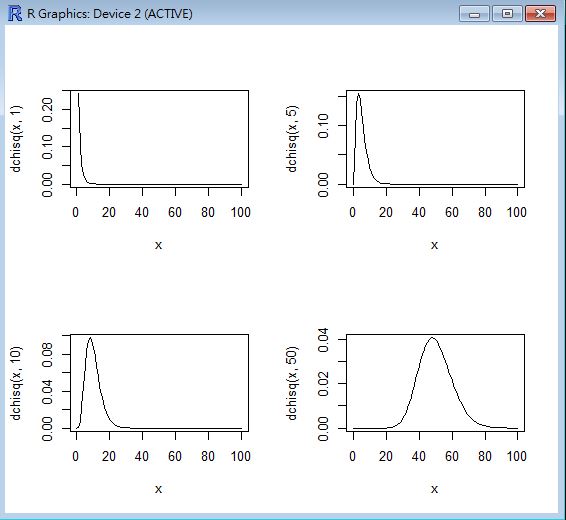
op=par(mfrow=c(2,2))
curve(dchisq(x, 1), 0, 100)
curve(dchisq(x, 5), 0, 100)
curve(dchisq(x, 10), 0, 100)
curve(dchisq(x, 50), 0, 100)
R 程式範例二
dchisq(1, df=1:3)
pchisq(1, df= 3)
pchisq(1, df= 3, ncp = 0:4)# includes the above

x <- 1:10
## Chi-squared(df = 2) is a special exponential distribution
all.equal(dchisq(x, df=2), dexp(x, 1/2))
all.equal(pchisq(x, df=2), pexp(x, 1/2))

## non-central RNG -- df=0 with ncp > 0:  Z0 has point mass at 0!
Z0 <- rchisq(100, df = 0, ncp = 2.)
graphics::stem(Z0)

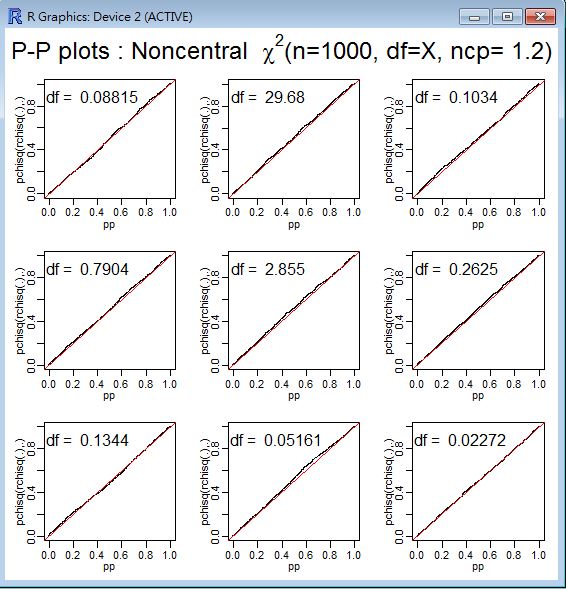
## Not run: ## visual testing
## do P-P plots for 1000 points at various degrees of freedom
L <- 1.2; n <- 1000; pp <- ppoints(n)
op <- par(mfrow = c(3,3), mar= c(3,3,1,1)+.1, mgp= c(1.5,.6,0),
          oma = c(0,0,3,0))
for(df in 2^(4*rnorm(9))) {
  plot(pp, sort(pchisq(rr <- rchisq(n,df=df, ncp=L), df=df, ncp=L)),
       ylab="pchisq(rchisq(.),.)", pch=".")
  mtext(paste("df = ",formatC(df, digits = 4)), line= -2, adj=0.05)
  abline(0,1,col=2)
}
mtext(expression("P-P plots : Noncentral  "*
                 chi^2 *"(n=1000, df=X, ncp= 1.2)"),
      cex = 1.5, font = 2, outer=TRUE)
par(op)
## End(Not run)

## "analytical" test
lam <- seq(0,100, by=.25)
p00 <- pchisq(0,      df=0, ncp=lam)
p.0 <- pchisq(1e-300, df=0, ncp=lam)
stopifnot(all.equal(p00, exp(-lam/2)),
          all.equal(p.0, exp(-lam/2)))
執行結果:
> dchisq(1, df=1:3)
[1] 0.2419707 0.3032653 0.2419707
> pchisq(1, df= 3)
[1] 0.198748
> pchisq(1, df= 3, ncp = 0:4)# includes the above
[1] 0.19874804 0.13229855 0.08787311 0.05824691 0.03853592
>
> x <- 1:10
> ## Chi-squared(df = 2) is a special exponential distribution
> all.equal(dchisq(x, df=2), dexp(x, 1/2))
[1] TRUE
> all.equal(pchisq(x, df=2), pexp(x, 1/2))
[1] TRUE
>
> ## non-central RNG -- df=0 with ncp > 0:  Z0 has point mass at 0!
> Z0 <- rchisq(100, df = 0, ncp = 2.)
> graphics::stem(Z0)

  The decimal point is at the |

   0 | 0000000000000000000000000000001122334455668903344577888899999
   2 | 1345667788899234689
   4 | 14813556
   6 | 2477733
   8 | 047
  10 | 3
  12 |
  14 |
  16 | 6

>
> ## Not run: ## visual testing
> ## do P-P plots for 1000 points at various degrees of freedom
> L <- 1.2; n <- 1000; pp <- ppoints(n)
> op <- par(mfrow = c(3,3), mar= c(3,3,1,1)+.1, mgp= c(1.5,.6,0),
+           oma = c(0,0,3,0))
> for(df in 2^(4*rnorm(9))) {
+   plot(pp, sort(pchisq(rr <- rchisq(n,df=df, ncp=L), df=df, ncp=L)),
+        ylab="pchisq(rchisq(.),.)", pch=".")
+   mtext(paste("df = ",formatC(df, digits = 4)), line= -2, adj=0.05)
+   abline(0,1,col=2)
+ }
> mtext(expression("P-P plots : Noncentral  "*
+                  chi^2 *"(n=1000, df=X, ncp= 1.2)"),
+       cex = 1.5, font = 2, outer=TRUE)
> par(op)
> ## End(Not run)
>
> ## "analytical" test
> lam <- seq(0,100, by=.25)
> p00 <- pchisq(0,      df=0, ncp=lam)
> p.0 <- pchisq(1e-300, df=0, ncp=lam)
> stopifnot(all.equal(p00, exp(-lam/2)),
+           all.equal(p.0, exp(-lam/2)))
>
參考文獻
柯西分布 (Cauchy Distribution)
公式: $\frac{1}{\pi} \frac{a}{a^2 + (x-b)^2}$
R函數:cauchy(location = 0, scale = 1)
- 公式:f(x) = 1 / (π s (1 + ((x-l)/s)^2))
- 說明:location=l , scale=s
- 網址:http://stat.ethz.ch/R-manual/R-patched/library/stats/html/Cauchy.html
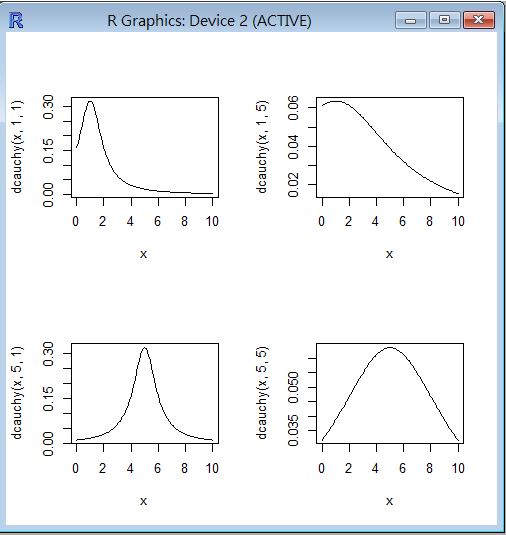
R 程式範例一
op=par(mfrow=c(2,2))
curve(dcauchy(x, 1,1), 0, 10)
curve(dcauchy(x, 1,5), 0, 10)
curve(dcauchy(x, 5,1), 0, 10)
curve(dcauchy(x, 5,5), 0, 10)
威布爾分布 (Weibull Distribution)
$\alpha \beta x^{\beta-1} e^{-\alpha x^{\beta}}$
用途:(可靠度工程) f(x) 失敗時間, R(t) 可靠度, [$ \rho(t) $]] 失敗率
R函數:weibull(a:shape, b:scale)
公式:f(x) = 1 / (π s (1 + ((x-l)/s)^2))
說明:location=l , scale=s
網址:http://stat.ethz.ch/R-manual/R-patched/library/stats/html/Weibull.html
特性
期望值:$\alpha^{-1/\beta} \rho(1+\frac{1}{\beta})$
變異數:$\alpha^{-2/\beta} \rho(1+\frac{2}{\beta}) - \mu^2$
動差生成函數: $m_x(t) = ??$
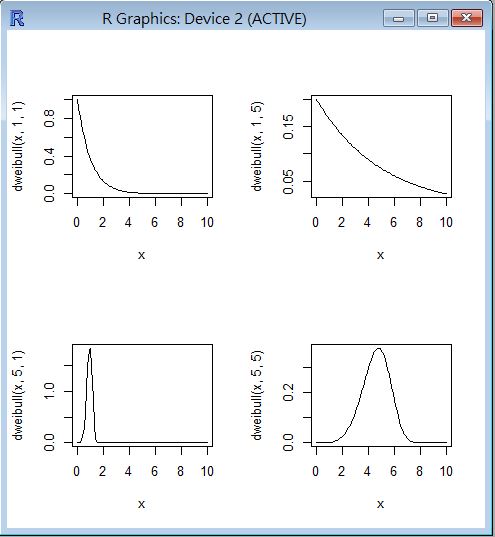
R 程式範例一
op=par(mfrow=c(2,2))
curve(dweibull(x, 1, 1), 0, 10)
curve(dweibull(x, 1, 5), 0, 10)
curve(dweibull(x, 5, 1), 0, 10)
curve(dweibull(x, 5, 5), 0, 10)
T 分布 (T distribution)
T 分配:Z 為標準常態分布,$X_\gamma^2$ 為自由度 $\gamma$ 的卡方分布。
公式: $T = \frac{Z}{\sqrt{X_\gamma^2/\gamma}}$
T 分布公式: $f(t) = \frac{\Gamma{(\gamma+1)}/2}{\Gamma(\gamma/2) \sqrt{\pi \gamma}} (1+\frac{t^2}{\gamma})^{-(\gamma+1)/2}$ ; 範圍:$-\infty < t < \infty$
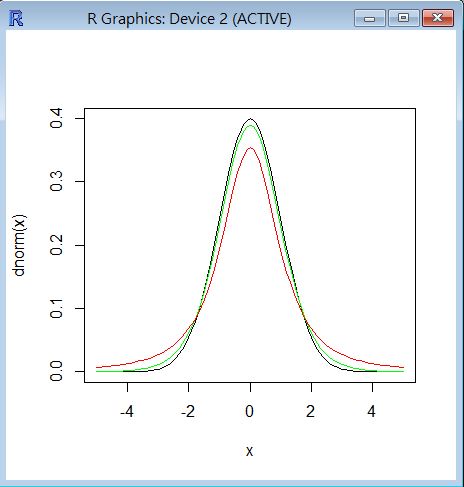
圖形:用 R 程式繪製 T 分布的圖形 (與常態分布 Z 比較)
curve(dnorm(x), -5, 5, col="black")
curve(dt(x, df=10), -5, 5, col="green", add=T)
curve(dt(x, df=2), -5, 5, col="red", add=T)
R函數:t(df, Del)
- 公式:T(df=n) := f(x) = Γ((n+1)/2) / (√(n π) Γ(n/2)) (1 + x^2/n)^-((n+1)/2)
- 擴充:T(df, Del) := (U + Del) / √(V/df) ; U ~ N(0,1) , V ~ χ^2(df) 且 (U,V) 獨立。
- 網址:http://stat.ethz.ch/R-manual/R-patched/library/stats/html/TDist.html
用途:可用來描述 n 個常態分布樣本平均值的分布。
描述:令 $X_1, X_2, …, X_n$ 為一組來自常態分布 $N(\mu, \sigma^2)$ 的隨機樣本,則下列算式服從自由度 n-1 的 T 分布。
$\frac{\bar{X} - \mu }{S/\sqrt{n}}$
估計:當 $\sigma$ 未知時,$\mu$ 的 $100 (1-\alpha %)$ 信賴區間如下
$\bar{x} \pm t_{\alpha/2} (s/\sqrt{n})$
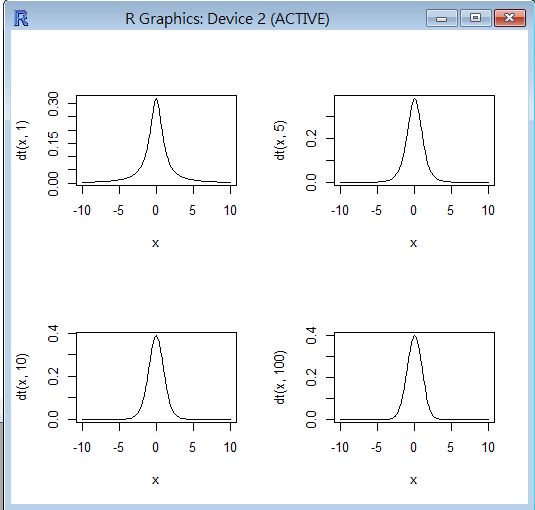
R 程式範例一
op=par(mfrow=c(2,2))
curve(dt(x, 1), -10, 10)
curve(dt(x, 5), -10, 10)
curve(dt(x, 10), -10, 10)
curve(dt(x, 100), -10, 10)
F 分布 (F distribution)
- 卡方分布 $X_{\gamma 1}^2$ 與 $X_{\gamma 2}^2$ 互相獨立,則下列算式服從 F 分配。
$\frac{ X_{\gamma 1}^2 / \gamma 1}{ X_{\gamma 2}^2 / \gamma 2}$
R函數:F(df1 = n1 and df2 = n2)
- 公式:f(x) = Γ((n1 + n2)/2) / (Γ(n1/2) Γ(n2/2)) (n1/n2)^(n1/2) x^(n1/2 - 1) (1 + (n1/n2) x)^-(n1 + n2)/2
- 網址:http://stat.ethz.ch/R-manual/R-patched/library/stats/html/Fdist.html
特性: 可用來檢定兩組樣本的變異數 [$ \sigma_1^2 , \sigma_2^2$]] 是否相等。
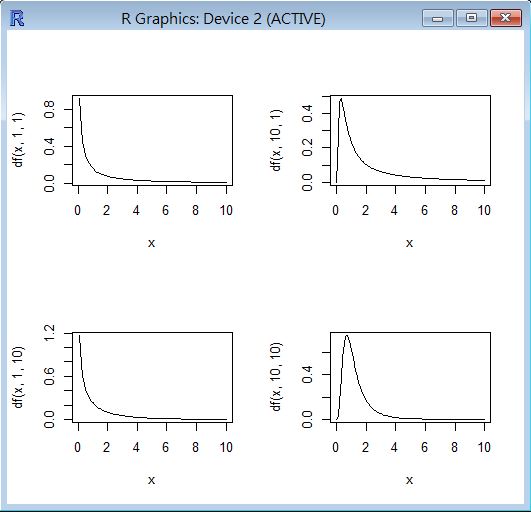
R 程式範例一
op=par(mfrow=c(2,2))
curve(df(x, 1,1), 0, 10)
curve(df(x, 10,1), 0, 10)
curve(df(x, 1,10), 0, 10)
curve(df(x, 10,10), 0, 10)
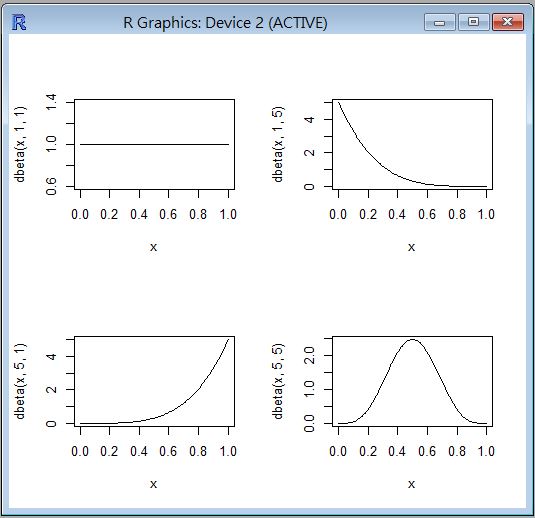
貝塔分布 (Beta distribution)
公式: $f(x)= \frac{Γ(a+b)}{Γ(a) Γ(b)} x^{a-1}(1-x)^{b-1}$
R函數:beta(a, b)
- 公式: f(x)= Γ(a+b)/(Γ(a)Γ(b))x^(a-1)(1-x)^(b-1)
- 對應:[$ shape1 = a; shape2 = b $]]
- 網址:http://stat.ethz.ch/R-manual/R-patched/library/stats/html/Beta.html
R 程式範例
op=par(mfrow=c(2,2))
curve(dbeta(x, 1, 1))
curve(dbeta(x, 1, 5))
curve(dbeta(x, 5, 1))
curve(dbeta(x, 5, 5))
